Calculating your Thanksgiving COVID-19 risk
One of my correspondents posted recently that, rather than living in fear, he was having 13 or more people to Thanksgiving at his house. Liberals and health professionals would have you believe that is risky. But just how risky?
We all do risk calculations every day. If cars are speeding by on a busy street, you don’t step out to cross it — there might be a one in ten chance you’d get hit. You wait for the walk sign to come on, so the risk is lower. Staying on the curb when the cars are speeding by doesn’t seem like “living in fear” because you have a good idea of the risk.
So you say “We won’t be living in fear,” what I think you are really saying is “I won’t change my activities based on an unknown risk.” And I get that. Unknown risks are hard to address — they feel like “fear.” But if the risk is known, the mental calculation no longer feels like fear, it just seems like simple prudence.
So let’s see if we can calculate the risks of a Thanksgiving gathering. The math is actually pretty simple.
What’s your Thanksgiving risk of COVID exposure?
To assess the risk that you’ll be exposed to COVID, you need to know two things.
First, how likely is it that each guest has COVID? And second, how many guests are there?
Remember that the most dangerous time for spreading COVID-19 is when there are no symptoms — either the person spreading it has a mild case and doesn’t realize it, or hasn’t yet developed symptoms. Assuming sick people with symptoms are likely to stay away from your Thanksgiving table, it’s the asymptomatic people that cause the risk.
The risk of exposure is a simple calculation if you know the infection rates. For example, suppose that the chance that a guest has COVID is 1%. Then there is a 99% chance that guest is not infected. If you have five guests, there is a 0.99 x 0.99 x 0.99 x 0.99 x 0.99 chance that all of them are COVID-free, which works out to 95%. So there’s a 5% chance you’ll be exposed.
Here’s a chart that calculates the chance of exposure for various sized gatherings and chances of infection.
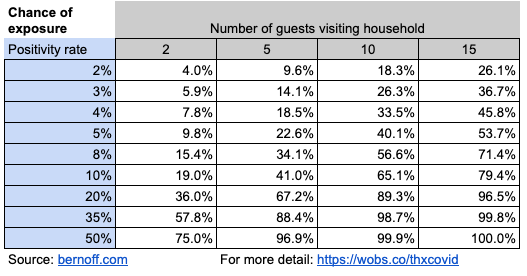
Just how likely are your guests to be infected with COVID-19? A clue comes from the rate of positives in testing, which Johns Hopkins compiles. I recommend that you check the Johns Hopkins page to learn the recent positivity rate for your state, because that changes your Thanksgiving risk significantly. For example, in Massachusetts, where I live, 3.2% of tests come back positive.
Added based on comments: To be clear, the test positivity rate in your state is not the same as the likelihood that a person in your state is infected. But higher test positivity rates indicate higher likelihoods of infection. One study indicated that in the US, more than 3 million people are contagious right now, of about 1% of the population, but this is doubtless higher in the parts of the country where the virus is raging. Your risk might be half or one quarter of the theoretical rates in the rest of this article — but that’s still pretty high.
COBID testing rates include both asymptomatic people getting routine tests (for example, health care workers) and people with symptoms. If I use the 3% rate, you can see in the second row of the chart that if I have two guests, my chance of exposure is six in 100, if I have five guests, it’s about one in seven, and if I have 15 guests, it’s one in three.
Some states are much higher. In Wyoming last week, 90% of tests were positive. South Dakota and Iowa had positive test rates of about 50%, so your chances of exposure in those states are in the bottom row: even five guests give you a 97% chance of exposure. In a state like Kentucky, which has an 11% positive test rate, you’d have about a one in five chance of exposure with two guests, and a four in five chance with 15 guests.
If your guests observed strict quarantine for two weeks before coming to Thanksgiving and got a negative test just before coming, you could significantly reduce the risks of exposure — so perhaps you can convince yourself to use a row higher up the chart than your state’s positivity rate would indicate. You can also reduce your risk by inviting fewer guests, and having guests drive to your house without stopping, rather than flying or taking a train or bus.
What’s your risk of contracting COVID-19?
COVID-19 is far more contagious than the flu. The conditions in which it is most likely to spread are in an enclosed space where people without masks are talking or shouting in close contact with one another. In other words, your family Thanksgiving.
Still, just because you are in an enclosed room with people talking doesn’t mean that they’ll infect you. Consider the superspreader event that was the Amy Coney Barrett nomination party, part of which took place inside the White House. A lot of people got sick (including the president). But some didn’t.
How should we estimate your risk of getting COVID-19 if you are exposed? That estimate would be different if everyone sat six feet apart, or if your uncle Julian tends to shout and project droplets everywhere. I’m going to use a rough estimate of 50%, which cuts all the numbers in the previous chart in half. If you think your family’s Thanksgiving is more or less infectious than this, then move up or down the rows in the chart accordingly.
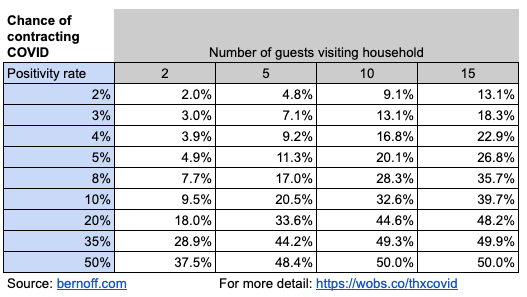
So in a state with a 10% positivity rate, like Kentucky, your chances of contracting COVID at Thanksgiving vary from about 10% to about 40%, depending on how big your gathering is.
We can also calculate how many guests at your event are likely to get infected, by simply multiplying the infection rate by the the number of guests. Here’s the result.
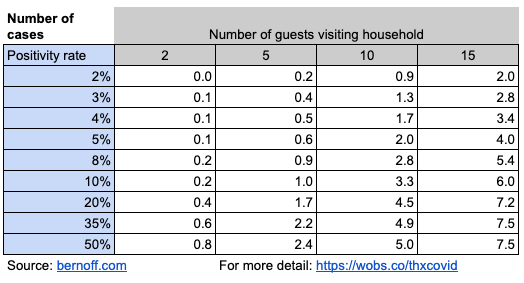
So at your Kentucky Thanksgiving dinner for ten people, about three will end up infected. In Massachusetts, your gathering of 15 will likely infect about three people. And in Iowa, your warm and friendly ten-person family dinner party will, on average, generate five more COVID cases. That might be your elderly parents, your kid home from college, or your annoying brother-in-law — or all of the above.
If you want to reduce your risk, do your Thanksgiving out of doors (probably a more realistic option in Florida than Minnesota), have a small number of guests at a very large table, and wear masks when you’re not eating. Be sure to wash your hands before eating.
What is your risk of you or other guests being hospitalized?
The best estimates I could make for hospitalization show that a little more than 6% of diagnosed COVID cases end up in the hospital. So we can apply this to the sick people from your Thanksgiving gathering. What are the chances that your Thanksgiving will put one of your guests into the hospital? Multiply the numbers in the previous chart by 6.2% and this is what you get.
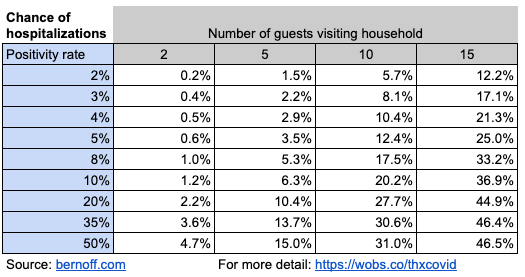
So your big party in Massachusetts has a one in eight chance of sending one of your loved ones to Brigham and Women’s or Mass General. And even your intimate five-person gathering in South Dakota has a one in six chance or landing somebody in an ICU.
Keep in mind that even those who survive can have debilitating long-term effects.
How likely is someone at your Thanksgiving table to die?
We now have pretty reliable statistics on death rates from COVID-19. About 2% of the people diagnosed with the disease will die.
So here’s the likelihood of somebody dying from your dinner party.
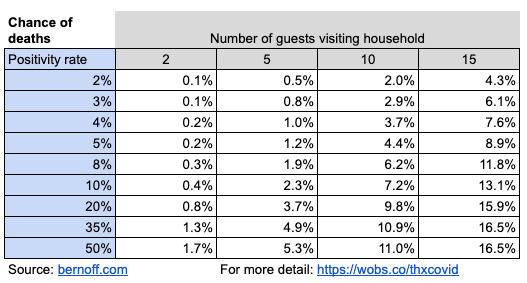
Just to take a typical example, in Utah, which has about a 20% positivity rate, if you have a Thanksgiving with ten guests, there’s a 10% chance that one of them will die of COVID. Consider your guest list carefully. Which of the people visiting would you prefer to have a one in ten chance of dying?
There is a problem with these estimates of deaths, of course. Given the number of Thanksgiving dinners taking place, there will likely be a surge in hospitalizations about two to three weeks after Thanksgiving. But there are only so many doctors and nurses, and only so many ICU beds. Some people who require hospitalization may not be able to get into the hospital. As a result, they won’t be able to get the care they need, and more of them will die. I think the death rate is likely to rise in early December, rendering the numbers in this chart on the low side.
Sure, these numbers could be off
There is quite a bit of uncertainty here. My estimates of the likelihood of infection after exposure aren’t solid. They could be high, they could be low.
My estimate that the test positivity rate is the same as the chance that a random person has COVID is just that — an estimate. It’s probably low, because most infected but asymptomatic people aren’t getting tested.
Doctors are getting better at treating COVID-19. So the death rates could be low. Or, because of the surge of cases that are coming, they could be high.
And you could take precautions I haven’t accounted for here, such as being tested ahead of time, and quarantining before the party. That would affect your risk.
If the risks were half what I estimated, would you still go ahead with Thanksgiving? What if they were twice what I estimated?
You don’t have to live in fear of the unknown anymore. Now you have an estimate of just how much risk there is. Do you still want to ignore what you’ve read here?
Of course, I also haven’t accounted for the strangers your guests may infect if they don’t get too sick. Will that be your family doctor? Your dog-walker? Your child’s teacher? Who knows? You might be responsible for the death of someone you never met.
I know you love stuffing. I know you love Uncle Fred’s stories and little Alvin’s card tricks and want to get a look at baby Ada, who you’ve only seen in cute pictures on Facebook, for the first time in person. I know you’ve had Thanksgiving at Grandma’s every year for the last 17 years. I know you miss hugging people you haven’t seen in a while.
Zoom is relaxing it’s 40-minute limit on free calls for Thanksgiving. Maybe it’s time to cancel your plans — after all, we’ll probably all be safe and vaccinated by next year’s Thanksgiving — and do a video call instead.
Fred’s stories and Ada’s smile and Grandma’s turkey aren’t quite the same on video as they are in person, but it’s better than the very real and measurable risking them getting sick or dying, don’t you think?
Thanks very much for getting this out – it should be widely circulated (with attribution).
Wow, that’s enlightening…The positivity rate in my County here in PA over the last 7 days is 9%…We’re spending Thanksgiving alone.
Terrific post, Josh. People don’t always have a good sense of risk and probability (it’s not innate). A “calculated risk” requires a bit of calculation. Thanks for posting this, and stay safe.
Absolutely brilliant piece Josh – sending it to all my American friends. We stayed home by ourselves over Canadian Thanksgiving. Thanks so much for presenting this good advice in an accessible way.
This was done well, except it seems to assume that the rate of infections (positivity rate of tests) equals the infection rate of the general populace within a state. In most states, testing isn’t random, but is focused on people who have been exposed or who have symptoms, so that would tend to indicate a higher positivity rate than the overall population. Nonetheless, this was a good and rational exercise you went through.
Wow! A coherent message with facts and science to back it up. How dare you tell the truth? Half of America may suffer a severe allergic reaction to it.
Just for some perspective. I am in Adelaide, South Australia. The state government, under direction from the CMO, yesterday implemented a “circuit-breaking” 6-day lockdown. This is on the basis of a a single cluster relating primarily to a single large family where around 15 family members have been diagnosed as infected out of a total of 34 active cases in the state. The majority of the state population is in Adelaide (around 1.2m). Genomic testing and high volume tracing has 1) put 3,200 into home-based, 14 day quarantine and 2) identified the covid strain as much more highly infectious and contagious. In relation to the 2nd point, the strain was imported from the UK from a repatriating and found in a quarantine medi-hotel. It has been identified that it can spread within about 3 days (rather than 10) and because it infects so quickly is mostly without symptom. So, to reiterate: in state of about 1.4m with about 550 TOTAL Covid cases since February and less than 10 deaths, we have implemented primary stay at home to restrict spread. Masking, no outside activity, no visiting, no school or uni, only essentials (like one visit by one person from the home to shops per day etc). We have border restrictions between states. I’d suggest that your statistics above may well be conservative if this (or similar) strains are identified in the US.
Josh, update: It looks like my state (New Jersey) is implementing new directives starting Monday. So the number of people coming over is going downward. Even if it’s just my wife and I plus our 3 kids (all under 18) and my mother-in-law (who moved with us when COVID-19 began and retired) we’re a family of 6. The most likely person to be asymptomatic and spread it to others will be there no matter what – me. My work brings me into contact with dozens of people every day and only associates & vendors have their temps taken entering the building.
Thanks for such an informative post.
This is interesting. One could take the poll data and calculate how many folks are expected to get sick over the holiday.
“But how exactly will Americans change their holiday plans? To find out, Fortune and Civis Analytics teamed up to survey 1,607 adults in the U.S. between November 6 and 9.”
“The numbers to know
31%
… of U.S. adults say they’ll travel this holiday season to visit family/friends (21%) or for vacation (10%). That’s down from 51% who traveled last year. ”
http://links.msg.fortune.com/e/evib?_t=5c2d888702774d17aa3d0350287b6d73&_m=9eafbc6c40644f07a6bf82e2fe4201f8&_e=sKbV0j1Yu5zB2z4eubzw5NQEgU5CWCh4-NvY0RaRmF3WDxlIjbMRfWlC63-4fgHE8gMUXpH-v8BqR4s3XZ24qtnSRGNMvwuwAZrxBhRzdumrV1-7r0PG7n4YpT43M024
I love this discussion. [This is from Norman, but he had trouble posting it]
Some notes:
1) JHU says on their site this about positivity rates: “Positivity rates are a measure of testing capacity…[they are] NOT a measure of how prevalent the virus is in communities.” The capitals are in the original. (https://coronavirus.jhu.edu/testing/tracker/overview)
2) If you use their data, this is what they do to fill in the three columns: State test rate times state population is the number of tests conducted weekly; that multiplied by the positivity rate is the number of new cases per week. So, Arizona is 2.1 tests/thousand, our population is about 7.5MM (no idea what JHU thinks it is), and with a positive rate of 16%, we ought to have about 2,600 cases this week; they said about 3,000, so it is close.
3) Positive rates and case — positive people — are always negatives; the test rate is neutral or loaded, depending on your point of view. If we tested everyone, that would be nice; if we test no one, the positive rate is nice; and in between, uncertainty reigns. The test rate can show folks’ tendency to be sick or crazy like me — I have had 14 tests, so far.
4) As you point out, folks likely do not get tested of their own free will unless they think that they have COVID. Folks can be divided into three main camps: 1) had COVID, 2) does not have COVID, and 3) has COVID. We are not sure if one is in camp 1 if one is then exempt from getting COVID again (or will suffer from having had COVID). Camp 2 is the good group–they cannot transmit COVID, but may be able to get COVID at some point. Camp 3 is further defined as asymptomatic (no symptoms, but likely contagious), pre-symptomatic (sick, but not showing symptoms yet, and likely contagious), or symptomatic (showing symptoms). All pre-symptomatic folks, by definition, become symptomatic. The split is estimated by CDC at 2:1 for the combination of pre- and symptomatic compared to asymptomatic. And as you point out, asymptomatic folks are the scary ones as they do not know nor appear as sick, but they are spreading COVID as they go about their normal lives.
5) That split estimate comes from CDC looking at the transmission rate in households. They estimate 36% for pre- and symptomatic and 18% for asymptomatic, for a total transmission rate of 54%. so, close to your estimate of 50%. (https://www.cdc.gov/mmwr/volumes/69/wr/mm6944e1.htm#:~:text=The%20rates%20of%20symptomatic%20and,%25%E2%80%9324%25)%2C%20respectively.)
6) JHU estimates the death rate at 2.2%, so close to your 2% estimate. (https://coronavirus.jhu.edu/data/mortality)
7) JHU also cautions against the difference between science and policy in this quote: “Policy decisions, like openings and closings or interstate travel, should not be determined based on test positivity alone.” (https://coronavirus.jhu.edu/testing/tracker/overview) That really ought to be emphasized in clearly stating that there is a distinct split of policy and science. Science ought to inform policy, but science and scientists should not set policy.
Have a great Turkey Day.
Norman is right that the big uncertainty in my calculations is the rate of positivity in the population. It’s likely not as high as the positive test rate.
This might cut your risk by a factor of two to four, or maybe more.
Still seems like Thanksgiving is a very risky thing to do with your family.