What is machine learning? A psychedelic graphical journey
You must always treat the reader’s time as more valuable than your own. That’s the Iron Imperative, and it’s just as valid for graphics as it is for text. If you find yourself endlessly fiddling with with an elaborate diagram, ask yourself, “Is this really helping?” Then get help from a decent graphic artist.
When explaining a complex topic, there’s a natural urge to explain it visually. The purpose of the graphic is to help a reader to say, “Aha, now I understand” and put the rest of content in context. Sometimes this requires the reader to spend a little more effort studying the graphic, but there are limits to how much effort readers will put in.
Take this graphic that I recently saw about machine learning:
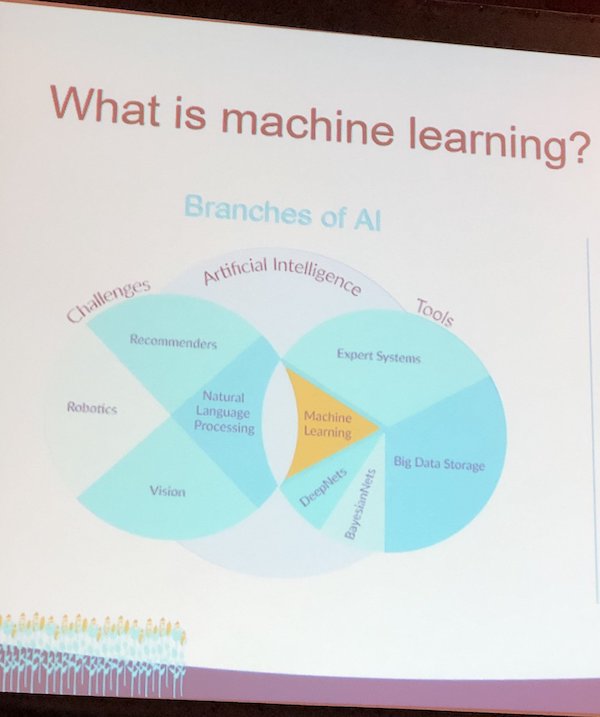
I saw this via a tweet from Tariq Krokhar, who is at SXSW. Regrettably, I couldn’t find the original source. Krokhar’s description is apt: “Rarely seen in the wild… the pie chart Venn diagram.”
What is going on here? First off, why are challenges, tools, and artificial intelligence all overlapping circles? What do the proportions within the pie-ish charts mean? What is the significance of the colors? And what’s the overlap? Ach, my brain hurts.
Is there a better graphical explanation?
Machine learning is a complicated mix of tools and technologies; a diagram could definitely help. So I searched for something better.
How about this?
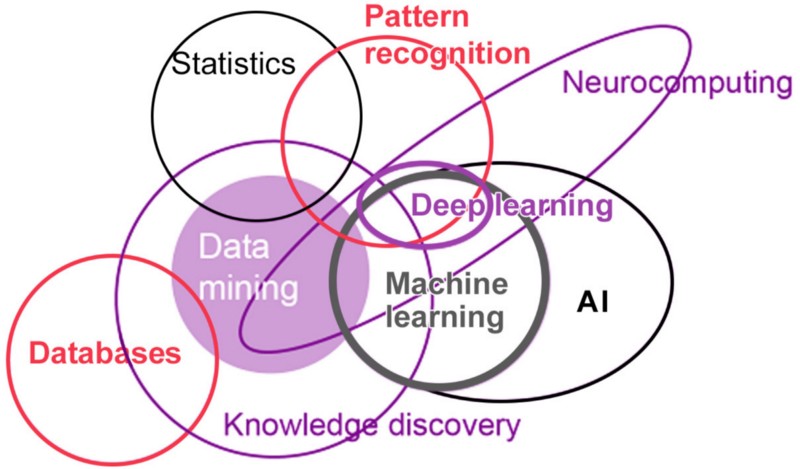
Well, now we’re down to a “simple” Venn diagram, but how much can you get out of it? Somebody worked hard on this, but it looks more like an orbital diagram than a description of a branch of knowledge.
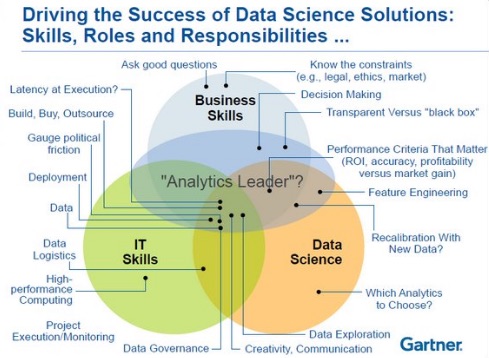
Gartner knows how to take a Venn diagram and make it rich . . . and impenetrable.
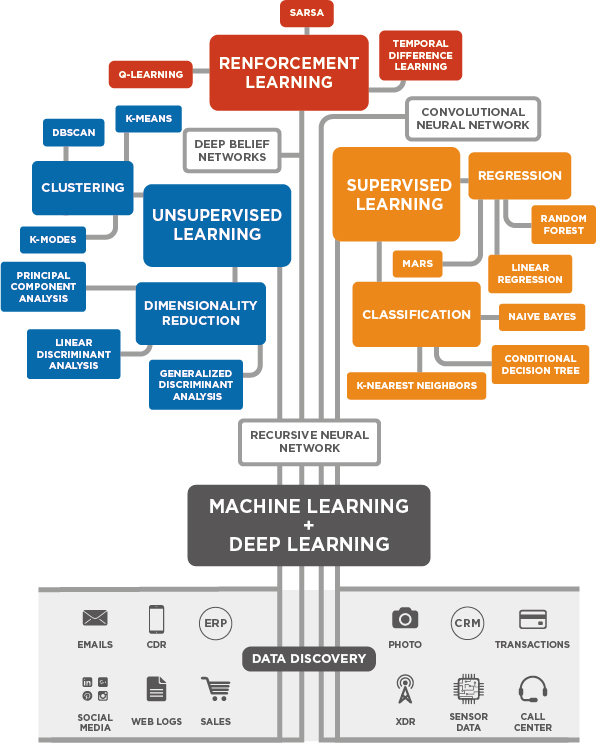
Still not getting it? Perhaps you need a fidget spinner.
That’s deep. I’m still not sure how all those dots connect (or why, on a graphic that clearly took hours to create, they couldn’t spell “reinforcement” correctly) but now we have a little better understanding of how the elements of machine learning ramify.
Maybe this would be better as a tree than a fidget spinner.
It’s nice to see the data in the roots of this tree, but somewhere in the branches the meaning is getting muddled.
Speaking of trees, this treatment seems popular.
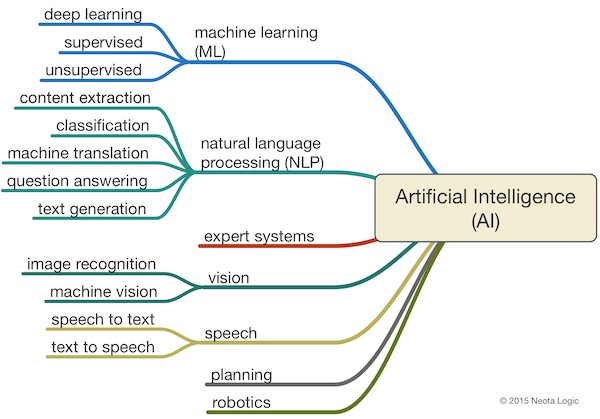
Near as I can tell, this is the ur-diagram of AI. It’s easy to understand. But it does leave some something behind. Is it the picture of a robot that’s missing?
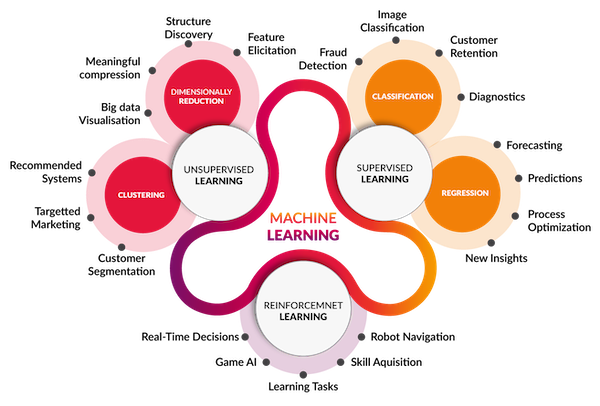
Maybe something simpler would be better.
I don’t think flower power is helping here.
A method to create better graphics
It’s easy to make fun of attempts at graphics. So, how would you solve this problem?
In my past efforts to solve a graphical problem like this, I usually take three steps.
- Figure out what you’re trying to communicate. Is it how the branches of AI relate to each other, or how an algorithm works, or something else? It’s best if you limit yourself to one or two key concepts, because, unless you’re very talented, trying to do more than that in one graphic creates confusion rather than clarification.
- Toss around some sketches, and refine. I can’t draw. But I can sketch. So I draw a few ideas on some paper and show them to people. I see which ones they relate to and work on those concepts. It’s an iterative process, much like writing and editing.
- Get an artist. Sketches are fine. But for quality work, hire a talented graphical artist or data visualization expert.
You could skip these steps. You could get as psychedelic as you want with your own tools. But don’t imagine that the results are clarifying anything.
As is usually the case with dataviz, less is more.
“When I use a word,” Humpty Dumpty said, in rather a scornful tone, “it means just what I choose it to mean—neither more nor less.” “The question is,” said Alice, “whether you can make words mean so many different things.” “The question is,” said Humpty Dumpty, “which is to be master—that’s all.”
2019. Lewis Carroll (1832-98). Respectfully Quoted: A Dictionary of …
https://www.bartleby.com/73/2019.html