Is America the best in the world in COVID success, or the worst?
Donald Trump believes that the US leads the world in successful management of the COVID-19 pandemic. His argument about that with Jonathan Swan, a reporter from Axios, was aired last night. Here’s part of it:
Since it’s worth discussing how you measure success with the virus, I took a look at the statistics and how the US ranked on various measures.
For the purposes of this analysis, I chose a cohort of similar large countries including places where the pandemic has raged out of control, such as Brazil. My comparison set includes Brazil, Canada, China, France, Germany, India, Israel, Italy, Russia, South Africa, and the UK. The data comes from worldometers.info, and is compiled from public health agencies around the world. There is inconsistency and inaccuracy in reporting across the globe, but some trends are clear.
Cases Per Million People
The US leads all countries with 4.86 million cases reported; Brazil is second, with 2.75 million. Of course, it makes more sense to compare cases per million population. Here’s how countries compare on that basis:
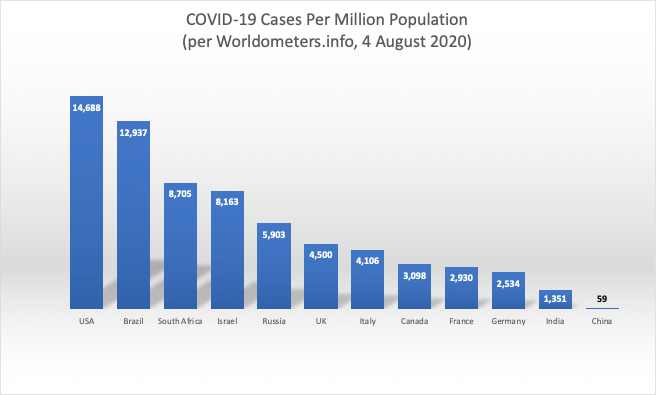
America also leads the world in cases per million population.
Trump argues that this is a result of more testing. However, the UK, Russia, and Israel have tested more people per million population and all three have far lower cases reported than the US does.
Deaths Per Million People
It’s hard to argue with a measurement of deaths per million people. While many COVID infections will have lingering effects for years, it’s the number of deaths that matter most. When Swan brought this up, Trump said “You can’t do that.” (Why not?)
Again, America leads the world with 159,000 deaths; Brazil is second with 95,000. How do countries compare on deaths per million population?
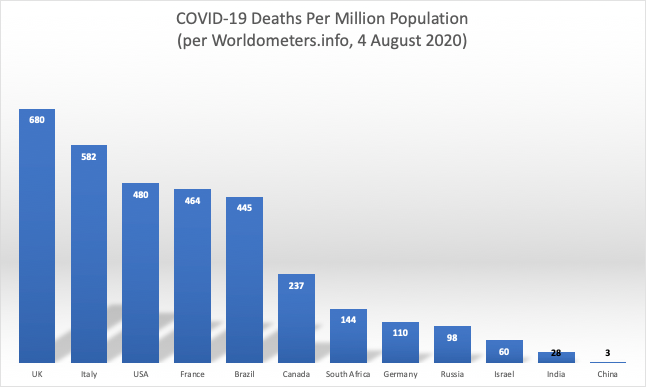
Now the US is third, behind the UK and Italy. Your chances of dying from COVID-19 in America are about one in 2000. Given the speed with which the disease is spreading in many parts of the US, it’s likely that it will soon surpass Italy to take over the number two spot.
Case Positivity Rate
The case positivity rate is the percentage of positive tests among all tests. Assuming there are lots of tests, a high case positivity rate indicates that the disease is raging; a low rate indicates that it’s under control, because any person who gets tested has a lower chance of actually being infected. (Think of it as a type of sampling).
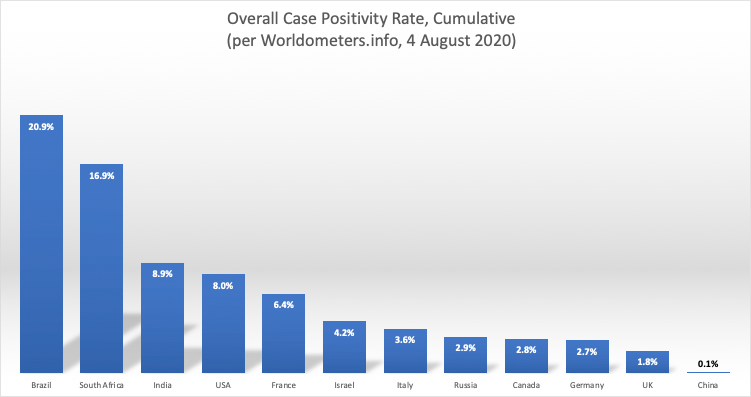
In this case the Worldometers data is not the best indicator, since it shows the cumulative number of tests and positives, rather than a current snapshot. For example, the US numbers are distorted somewhat due to the early outbreak in New York. But again, America’s rate is troublingly high compared to places where the pandemic has been relatively well controlled, such as Canada and Germany. According to Johns Hopkins, the US current case positivity rate (recent tests) is 7.7% as of August, 2020, which indicates continued spread of the virus. Things are worse in Brazil and South Africa.
Deaths Per Thousand Cases
In the interview, Trump seemed fixated on the American success in deaths per thousand cases. I think deaths per million people is a better measure, but deaths per thousand cases does measure something: the success or failure of our health care system. Low deaths per thousand cases would mean we are winning on the number of mild cases that don’t require hospitalization, and on the survival rate of those who do require hospitalization.
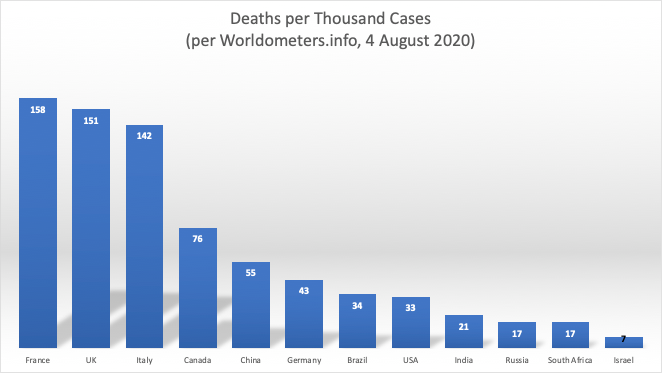
Here at last we find a category in which the US is among the best. If you’re diagnosed with COVID in the US, you are less likely to die than in other countries including France, the UK, Italy, Canada, and Germany.
However, in the US, 33 out of every thousand people who get COVID-19 will die. Given the continuing spread of cases, that means lots more people dying.
How to use statistics
In politics, you choose the statistics that make you look the best.
In epidemiology, science, economics, and market research, you choose the measures that are important first, then see what the numbers say. This is how you find the truth rather than fooling yourself.
I don’t find solace in the fact that Trump’s advisors have found a measure on which the US is doing relatively well. I’d be a lot happier if we were leading the world in reduction of the spread of cases and with the lowest number of new deaths per thousand people.
One more thing. If you choose your stats based on what looks best, you cannot identify the problem and solve the problem. Optimism is not a strategy. We need a strategy, and that requires facing the problem squarely, not convincing journalists — and yourself — that some oddball metric is really what matters.
Thank you for this…I watched the clip on NBC this morning and your piece just made it clearer about who was using what statistics.
If America ranked last in COVID deaths by people who ate a cheeseburger at Wendy’s on the 12th of a month between 2 pm and 4 pm, this president would brag about it.
Lies, damned lies, and statistics…
Deaths Per Thousand Cases – Sure the US is relatively low, but how much of that is due to the lower average age for cases?
“If you’re diagnosed with COVID in the US, you are less likely to die than in other countries” – to conclude that, we need to compare Deaths per Thousand Cases by age groups across countries.
You allude to it in the writeup, “winning on the number of mild cases that don’t require hospitalization”, but that could be the most significant factor for the lower number in the US.
Florida went from >60 to the mid-30s recently, IIRC. Since we know that the death rate is significantly less for those under 40, if other states are experiencing similar numbers, that could skew the entire US results to look better than it really is (relative to other countries).
Case Positivity Rate – you are correct that cummulative doesn’t really provide a useful picture. As you state, recent US tests are 7.7% (probably over the last 14 days?) – still above the WHO recommended threshold of 5% for 14 days.
Short of a vaccine (we don’t know when, nor how effective – it/they won’t be 100%), herd immunity is what will have to happen. Based on the inherent infection rate, estimates for herd immunity are 60%+ of the population (i.e. 198M people). We have only about 1.5% of the population tested positive (4.8M).
Until herd immunity, or wide spread distribution of an effective vaccine, one set of statistics that is missing, but critical, is related to medical capacity. The number of hospital beds, number of ICU beds, number of ventihlators (and the PPE, and staffing to support these). While this won’t be meaningful in aggregate, it is critical to know at the local level (within the medical service area of a population center), as we don’t want the medical system to be overwhelmed with COVID-19 cases.
Haven’t found a report yet that drills down to the local level, and don’t see any consistent reporting on this from various local sources. The closest is this one, by state (hopefully, the state and local governments are tracking to a more granular level):
https://covid19.healthdata.org/united-states-of-america
The extent that these local resources are near capacity limits is when we know things will get bad. Should several locations reach these thresholds simultaneously, then there is little opportunity to shift resources to address the hot spots, and that will be very bad for many of us.